

Our Platform
Every room you monitor, scored, ranked and alerting — so your team knows which spaces need attention today, and can prove what changed after they fix them.
For building managers and administration
AirSuite Monitor Portal
The Monitor Portal turns readings from every room into something a facilities team can act on this week.
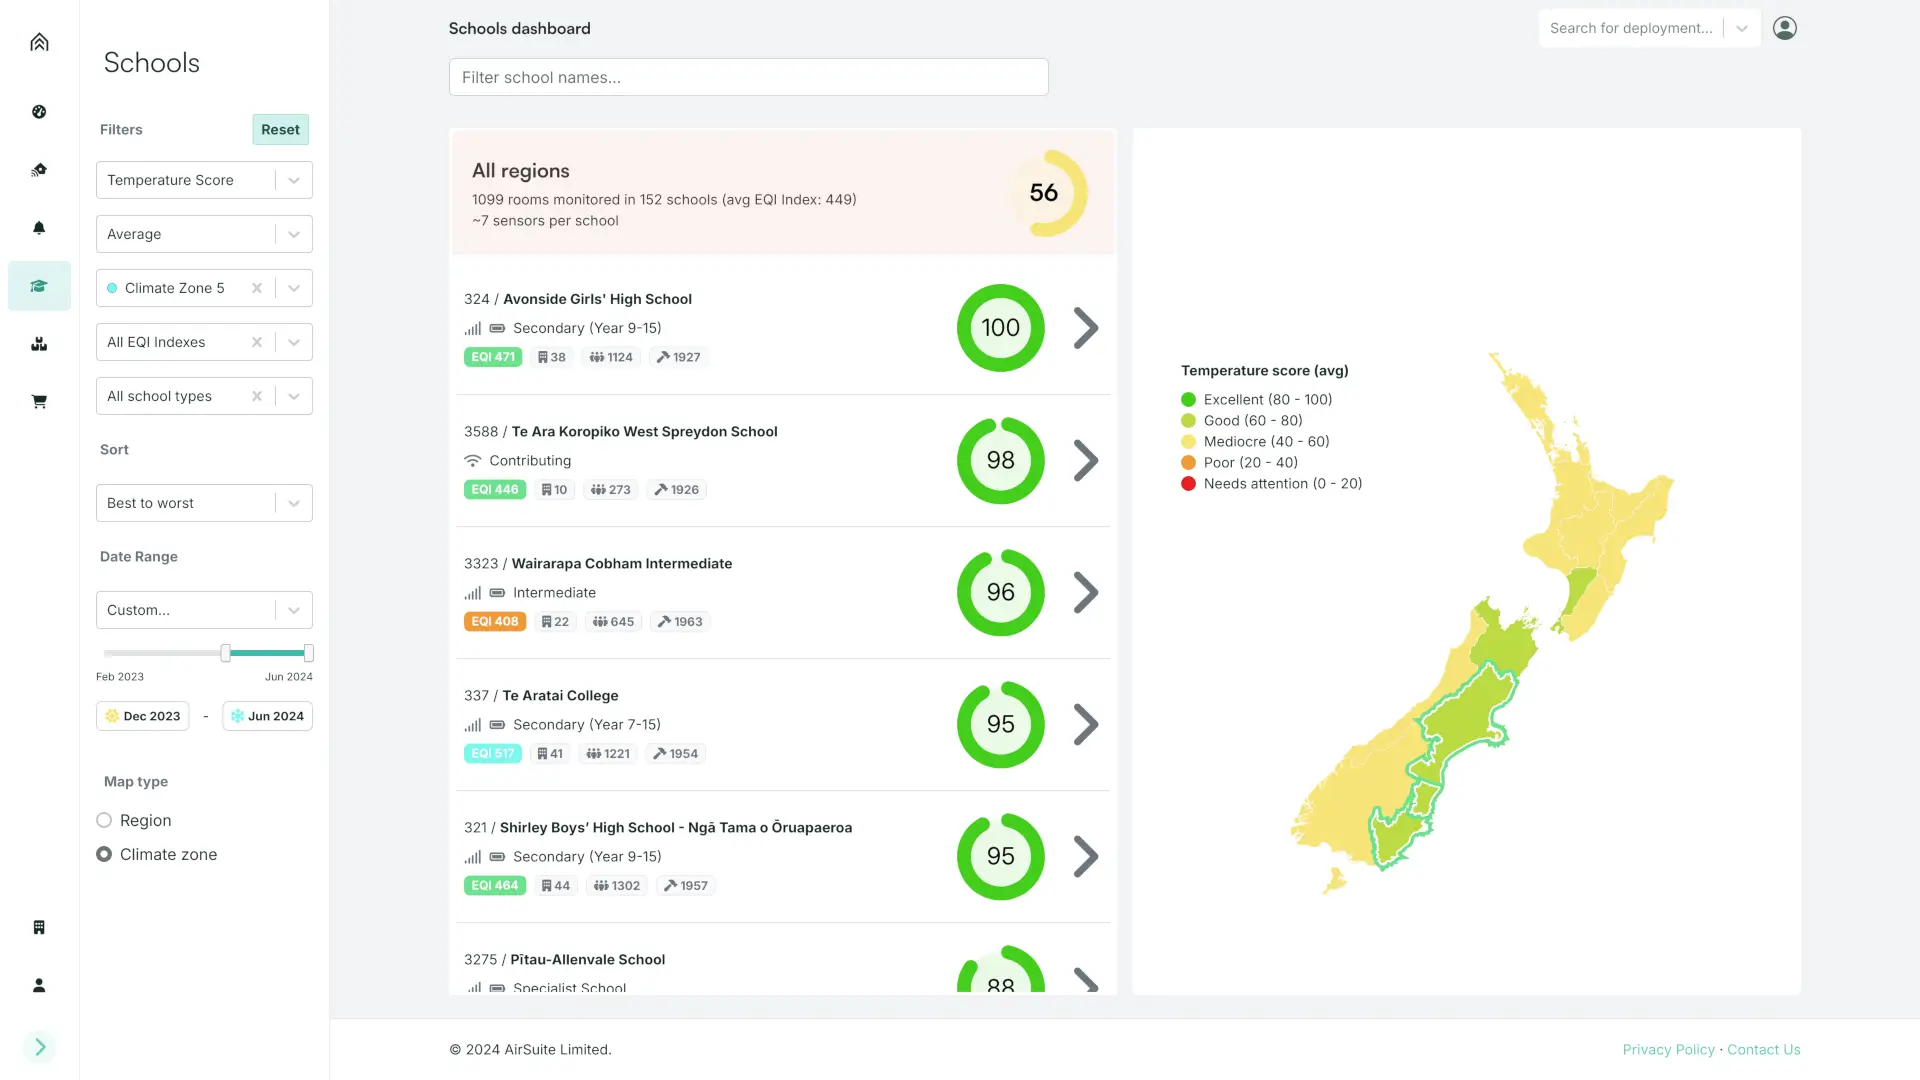
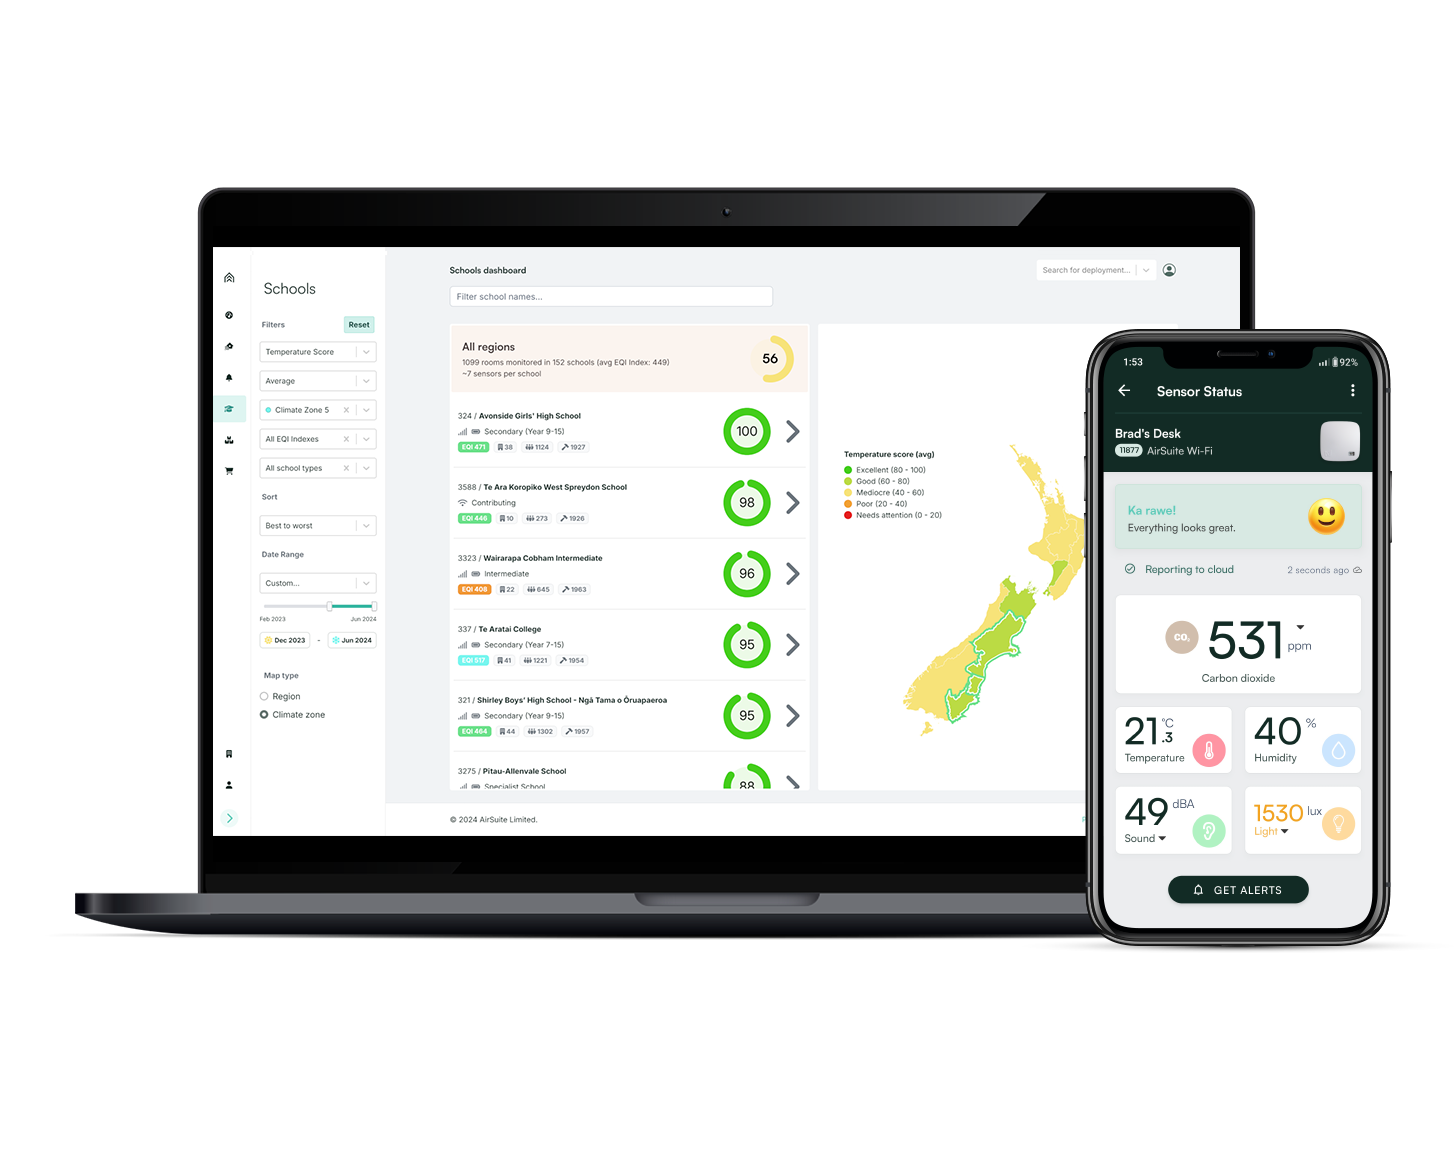
Monitors group themselves into properties by location, so a portfolio organises itself as devices come online. Each space is scored against the conditions that matter and ranked against the rest, which means the answer to “where do we start?” is on the first screen rather than buried in a chart.
Organisations, roles and invitations control who sees what, so a regional manager, a caretaker and a consultant can each work from the same data without seeing each other’s sites.
No portfolio is too big: the Portal already runs tens of thousands of air quality monitors for existing customers.
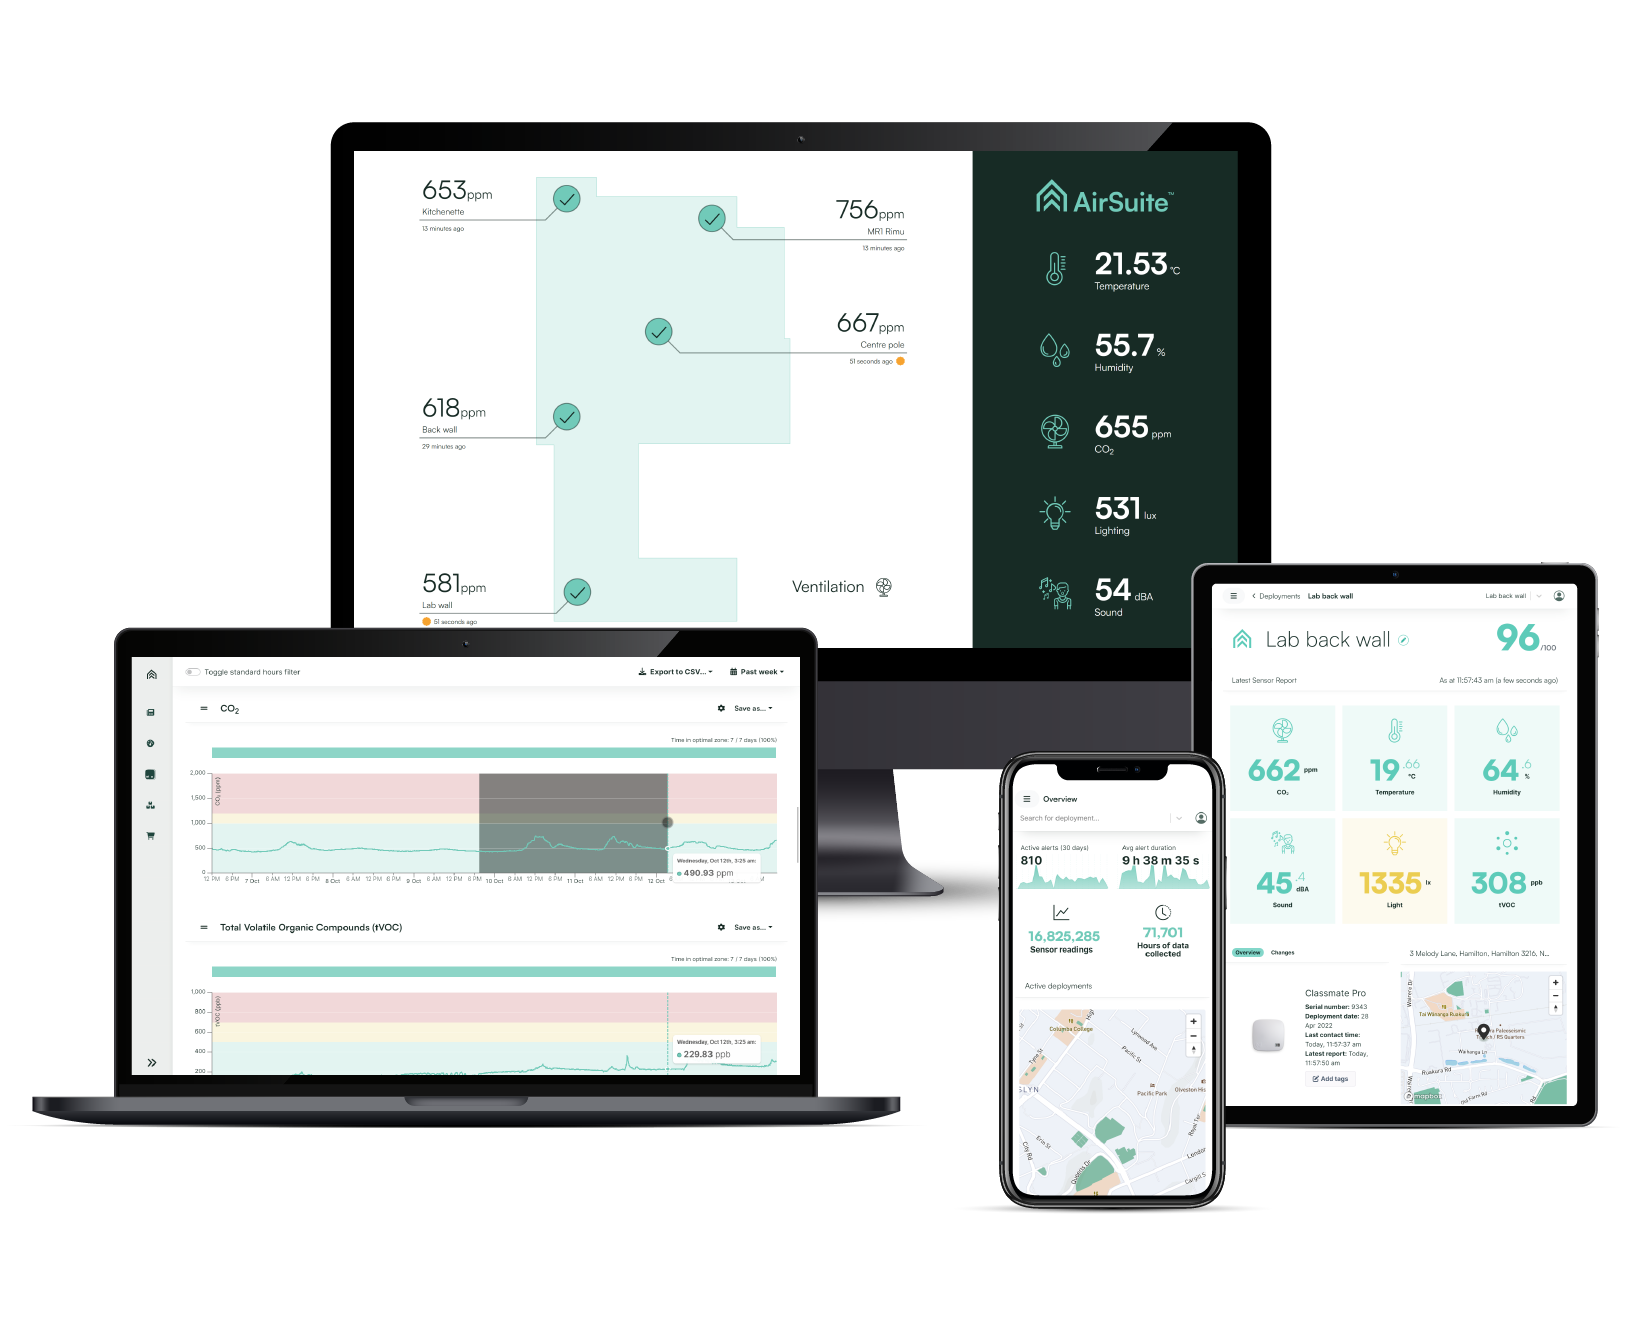
One tool to easily manage all your indoor environments
Monitor environmental conditions and trends across your entire building network. Using insights from long-term monitoring, AirSuite can help you identify where to focus your resources.

Get real-time email alerts or push notifications
Up-to-the-minute alerts and recommendations empower occupants to improve conditions, and long-term tracking helps administrators plan, prioritise and forecast.
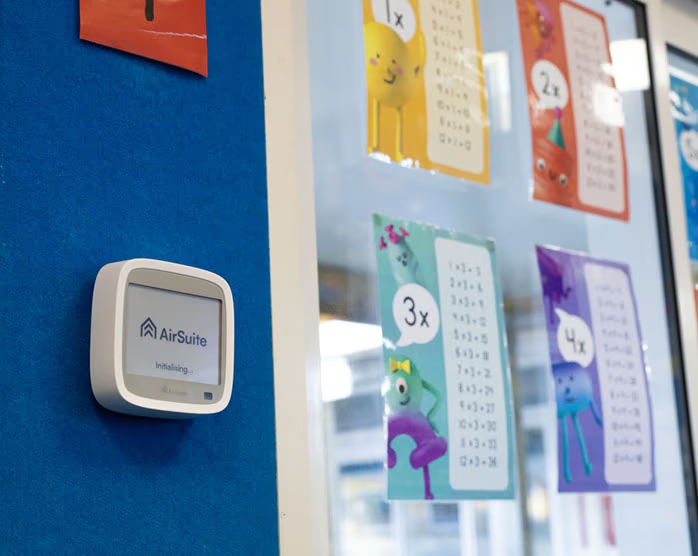
Gain confidence through improved visibility
Share air quality metrics with building occupants in real time and improve confidence in the healthiness of indoor environments.
See it working
Two ways to look around the Portal
A narrated walkthrough for anyone about to start using the Portal, and a short silent tour if you would rather just see what it looks like.
What the Portal does
Built around the questions facilities teams actually ask
Every AirSuite subscription includes the Monitor Portal. These are the tools your team gets from day one, without add-ons or professional services.
Scores and rankings
Each room and property is scored against the conditions that matter and ranked against the rest of your portfolio, so the spaces needing attention surface themselves. Compare like with like across regions and climate zones.
Alerts
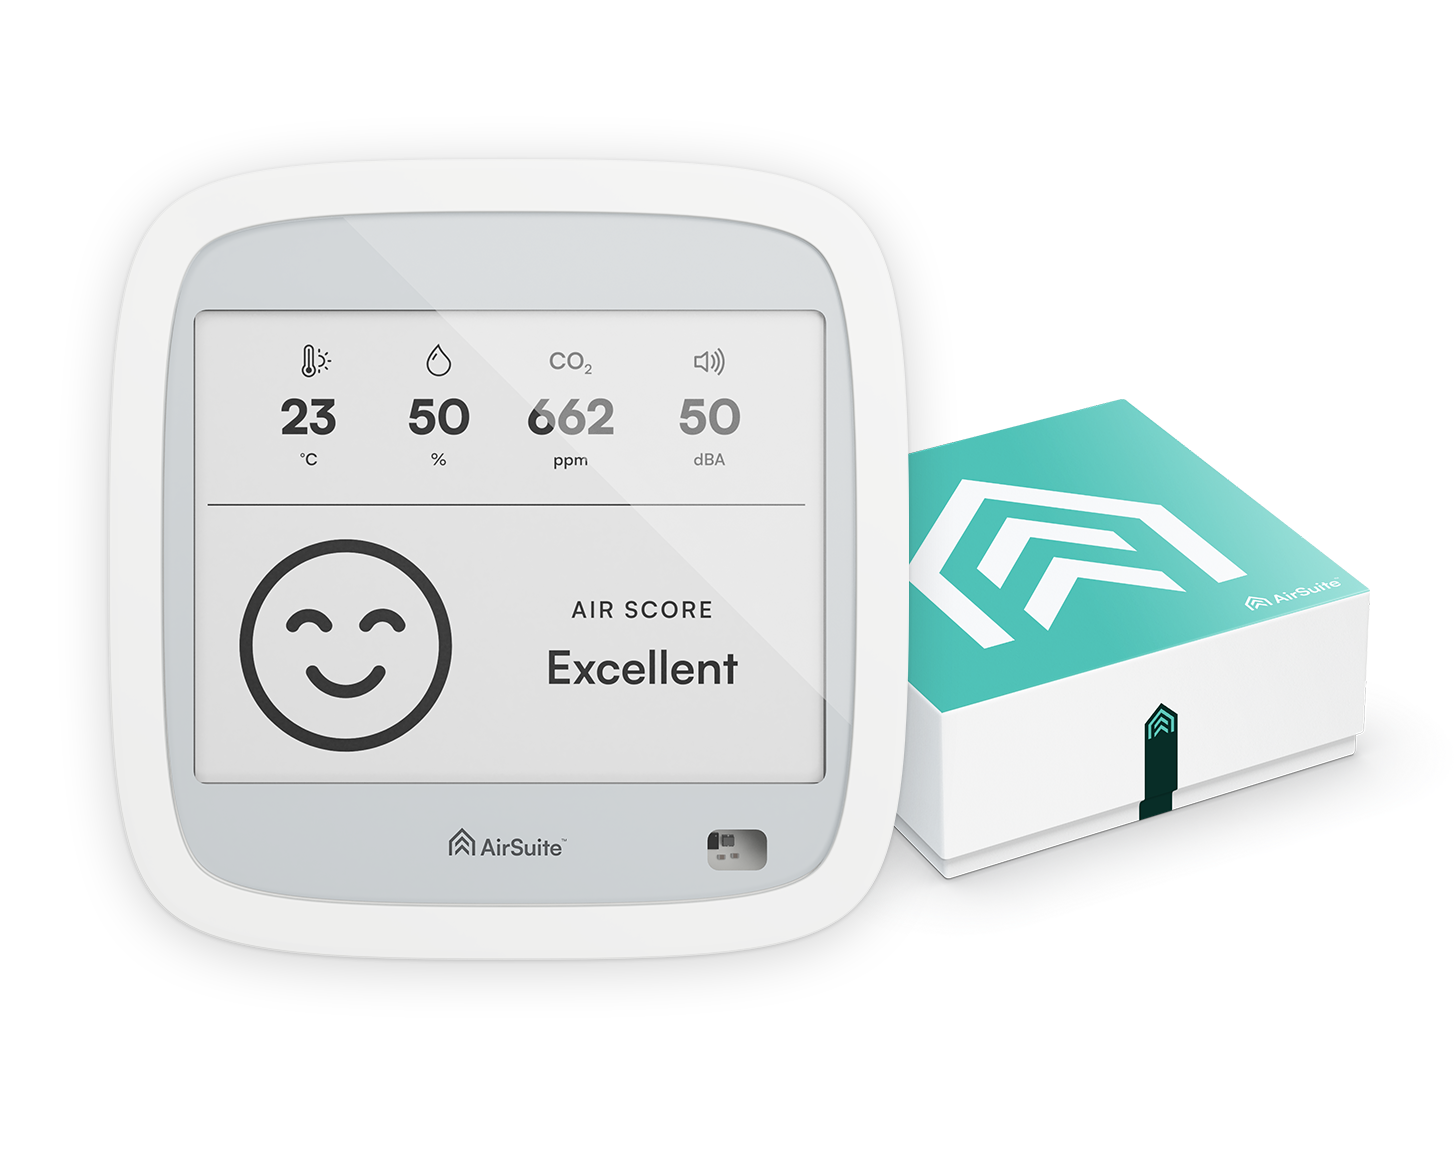
Set thresholds for your organisation and the Portal raises an alert when a space drifts out of range, with email and mobile push notifications for the people who opted in. The same thresholds drive what your AirSuite Glance displays show on the wall.
Reports
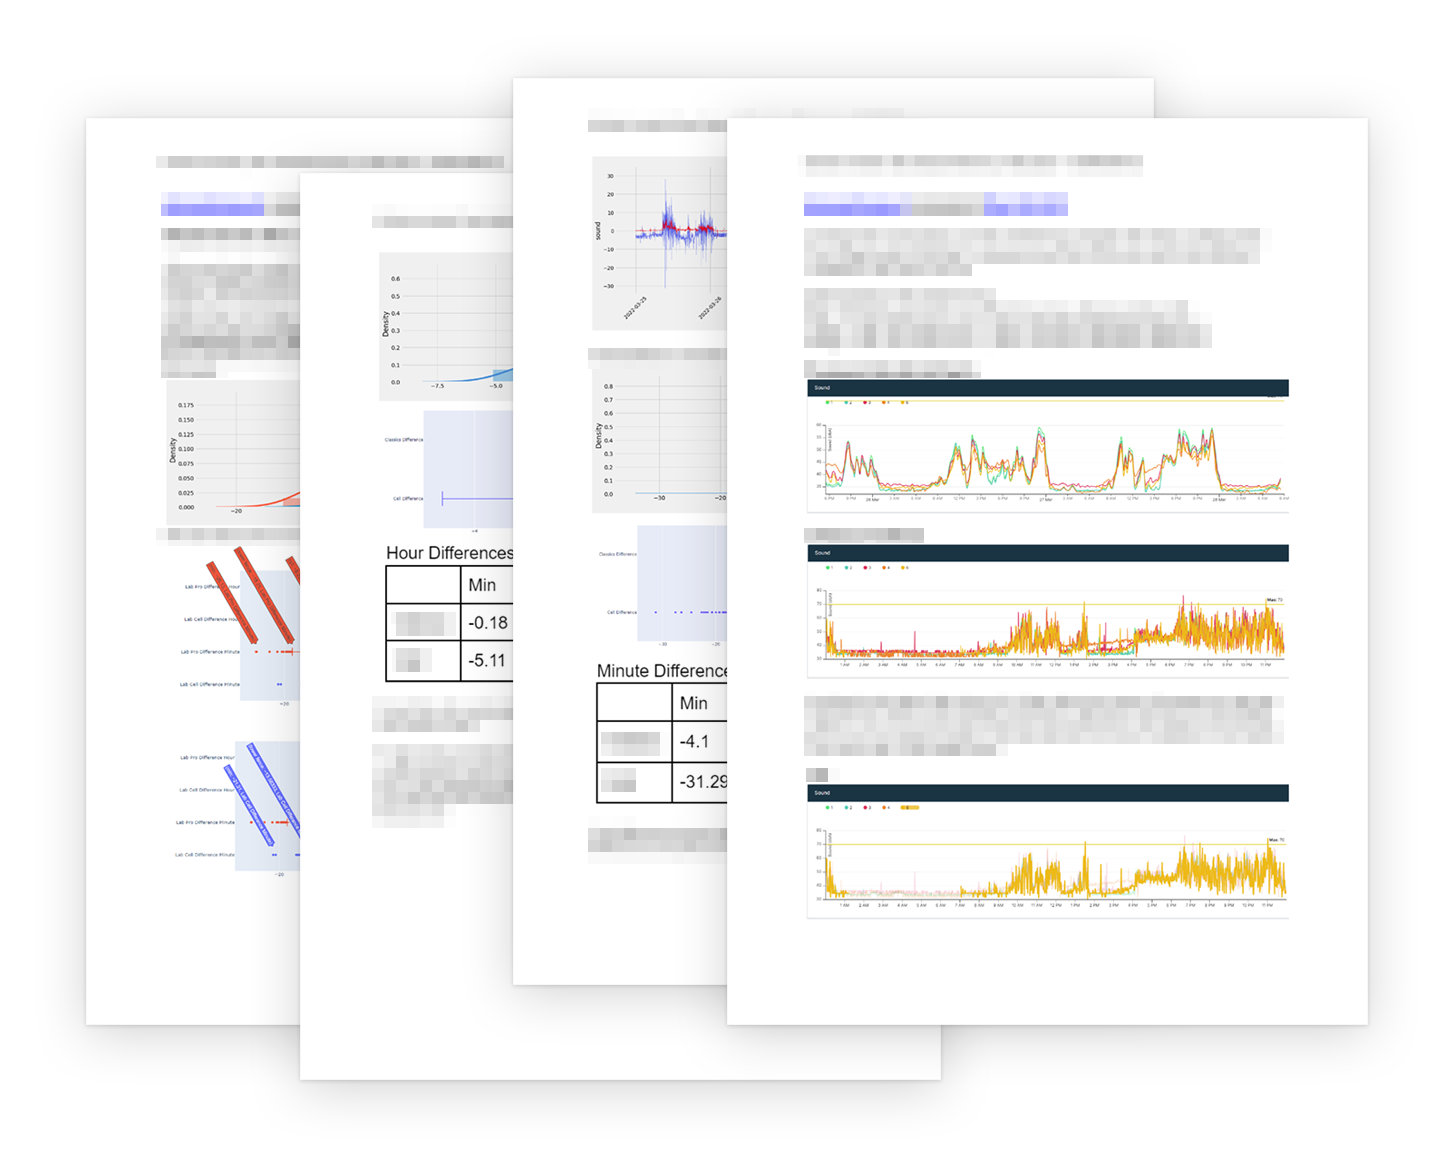
Summary reports are generated and emailed on a schedule, using the same score bands you see in the Portal, so the people who need the numbers monthly never have to log in to get them.
NABERS calculator
Turn your monitoring data into the Indoor Environment figures the official NABERS calculator asks for — air quality, acoustic comfort, horizontal illuminance, PM10 and carbon monoxide — ready to copy straight across.
Data export and API
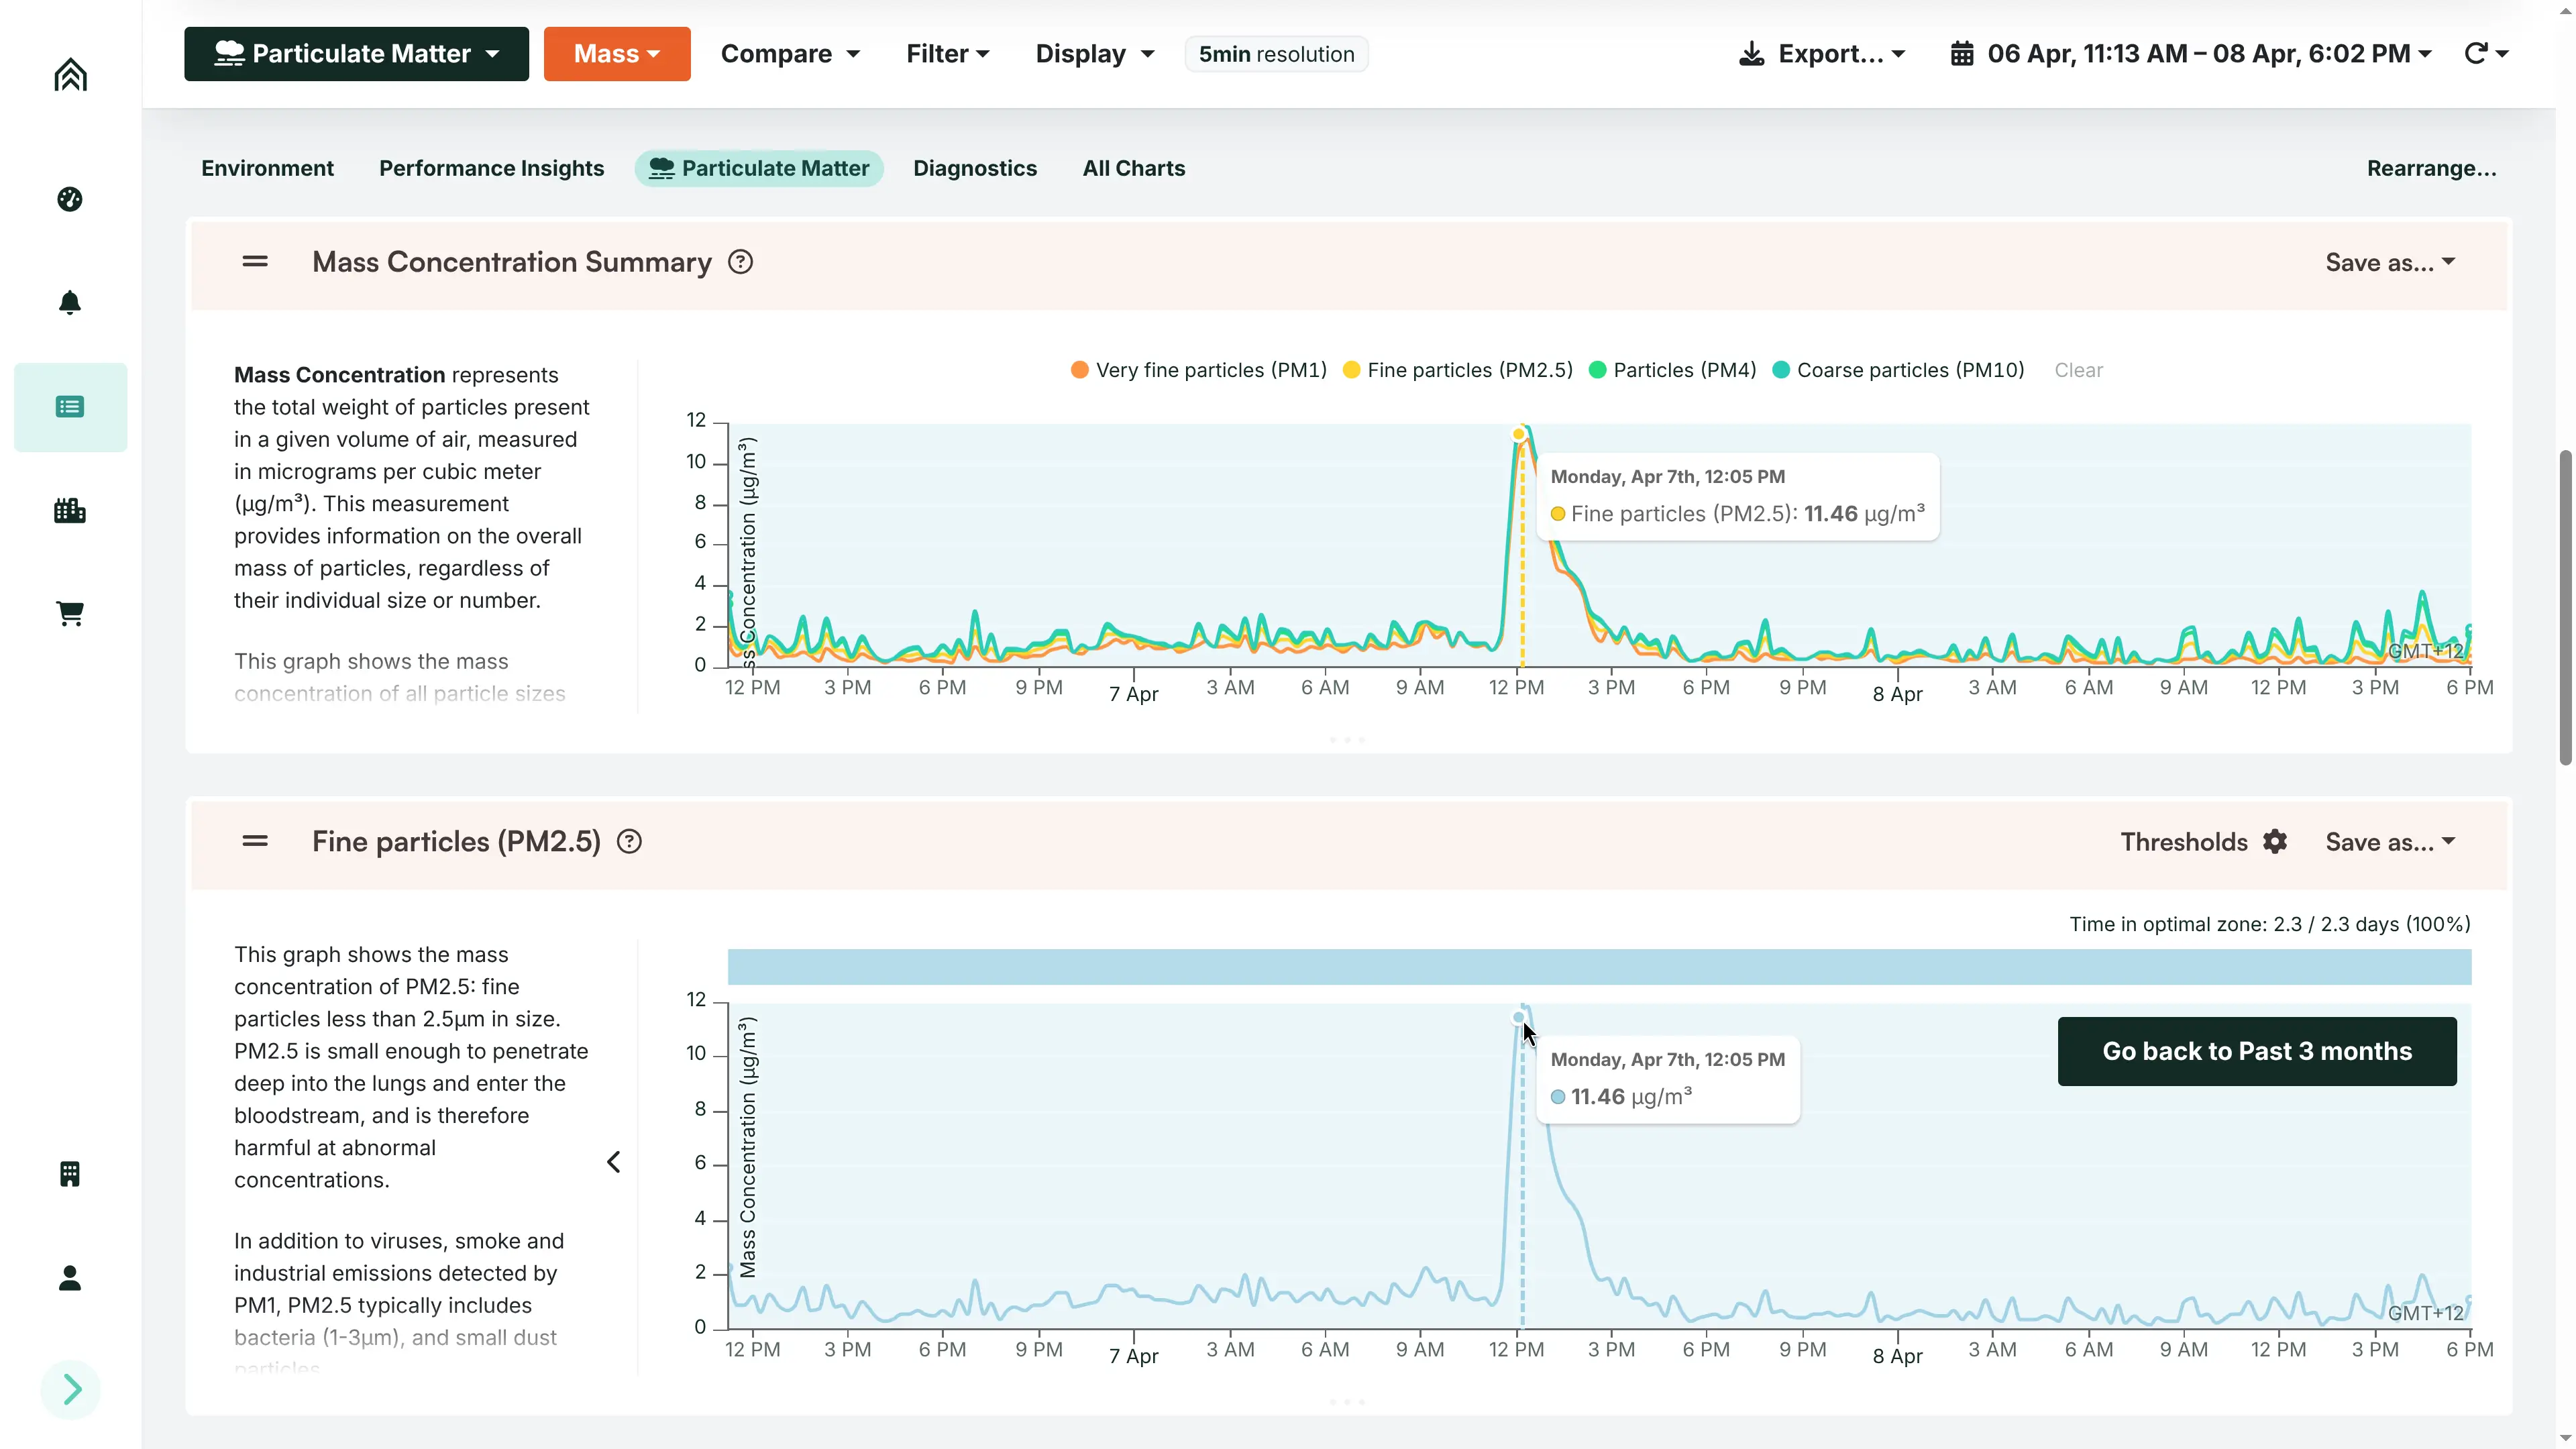
Export chart data as CSV, whole dashboards as PDF, or bulk extract raw readings. Our documented REST API pulls the same data into a building management system, reporting stack or data warehouse.
Fleet health
Battery levels, connectivity and inactive devices are monitored automatically. You find out that a sensor stopped reporting from the Portal — not from a gap in a report months later.
For building occupants
AirSuite Monitor App
The Monitor App puts the same live readings in the hands of the people actually in the room. Conditions update as they change, push notifications arrive when a space goes out of range, and each alert comes with a specific recommended action — open a window, turn the extract fan on — rather than a number to interpret.


Energy monitoring and load management
Install a Re.Flex Hub and your electricity data appears in the Portal alongside your air quality monitors — the same properties, the same people, one login. Fit Re.Flex Edge Controllers to the appliances that drive your peak, such as heat pumps, commercial HVAC systems and hot water cylinders, and the Portal can manage those loads as well as measure them.
Three-phase measurement
With a Re.Flex HubVoltage, current, power factor and active, reactive and apparent power on every phase — with phase imbalance and net import and export across the site.
Load management
With Re.Flex Edge ControllersControllers fitted to the appliances that drive your peak hold the site under its phase current limit, stepping those loads down to 75%, 50% or off as demand rises, then releasing them again.
Proof it worked
With Re.Flex Edge ControllersReporting on time spent in each load state and time above the current setpoint, so you can see how often the limit was approached and what it took to stay under it.
Custom integrations
Your data doesn’t have to stay in our Portal
The AirSuite REST API gives you real-time access to raw data straight from your sensor network — the same readings the Portal works from, with no export step in between. Where you already run a building management system, reporting stack or data warehouse, AirSuite monitoring feeds it directly.
Ready when you are
Let’s talk about how AirSuite™ can deliver real indoor outcomes for your organisation today